
You
have subscribed to Joe Ross' Weekly Spread Scan Newsletter.
If you have problems reading this newsletter, please follow this link:
Spread
Scan Issue: December 27, 2006 - Volume 124
To unsubscribe, scroll past the end of this newsletter and click the "unsubscribe" link.Otherwise, welcome to this week’s issue of the
Joe Ross Spread Trading Newsletter.Each week we present spread trading examples and opportunities in order to help you become a more professional spread trader.
Be sure you receive all your issues of Spread Scan so that you can continue to enjoy learning through the best free educational trading information available, and so that we can keep you informed about additional educational services and products to help you grow as a successful and profitable spread trader.
Dear Spread Scan Subscriber:
Our Team at Trading Educators is offically on vacation from December 15, 2006 through January 15, 2007.
We are continuing sending out Spread Scan. However, we will not include a Spread Commentary or Previous Spread Trades in our issues # 123, 124, and 125. We will start writing the Spread Trading Commentary officially again in issue 126, on January 10, 2007.We hope you will continue your subscription with us.
Thank you for your understanding.Your Team at Trading Educators
http://spread-trading.com
http://tradingeducators.com
TRADE WHAT YOU SEE
I am a firm believer in trading what you see, and not what you think. The two must be divorced.
Trading what you see can be applied to every aspect of trading, even classical technical analysis. I was taught classical analysis at the beginning of my career.
I still use it when I have the time to do the work.Years ago I taught the following lesson to some of my students:
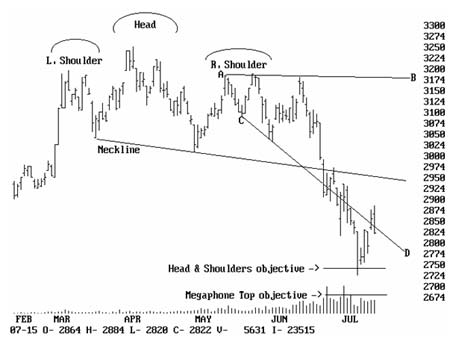
Notice the weekly wheat chart. Wheat had been in a long term downtrend
when I came across a beautiful case of classical technical analysis.The situation I'm referring to occurred in the December 1991 Wheat contract.
It involved what has come to be known as a "Head-and-Shoulders" formation, along with a second formation known as a "Megaphone Top," (Lines: AB and CD.
The combination of these two technical patterns suggested that the price of wheat would see a significant downside erosion before bottoming out.
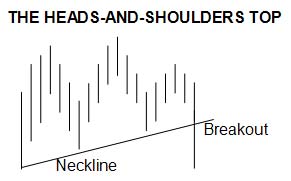
The head-and-shoulders reversal formation is perhaps the most well-known of all technical patterns. Though usually found at the end of major up or down trends, it also can occur at the end of medium-term trends.
A head-and-shoulders bottom is a graphic representation of accumulation by investors, while a head-and-shoulders top is a graphic representation of distribution by investors. Since I will be discussing the head-and-shoulders top on the wheat chart, I will limit my remarks to the mechanics of the head-and-shoulders top.
First, an extensive rally ends on heavy volume as investors take profits in what they consider to be an overvalued situation. The decline is halted at the low of what will be the end of the left shoulder, prior to rising to the top. At this point, volume drops off and buyers enter to take advantage of the perceived bargain opportunity.
Next, demand is sufficient to take prices to new highs at the top of the head of the head-and-shoulders formation. However, typically this advance will take place on less volume than the advance that created the top of the left shoulder.
Looking at price alone, you would see no indication that the trend is over, but the alert trader will have noticed the decline in volume on the rally to the top of the head.
Next, profit takers sell into the strength of the rally to the top of the head, pushing prices back down to what is to become the base for the rise to the top of the right shoulder. Prices may even descend to break the support line from the rise to the previous high.
Then the remaining bulls step in again to push up to the top of the right shoulder. Usually volume is thin compared with the previous rallies.
Finally, one last sell-off follows on very heavy volume, pushing price down through the neckline. The neckline is a trend line drawn to connect the low at the end of the left shoulder to the low at the beginning of the right shoulder.
Estimating The Fall
The question becomes, "How far will prices fall?"
The way I was taught to figure this from the head-and-shoulders formation, is to measure the distance from the top of the head straight down to the neckline. This distance is the amount that prices are supposed to move downward from the point at which prices penetrate the neckline to the downside. I've shown this objective on the chart. Note that time is not a factor here. It is not known how long prices will take to make their plunge.
Megaphone Tops
A megaphone top is also known as a broadening top. Similar to the head-and-shoulders, it consists of five stages. The broadening top in wheat occurred as part of the right shoulder. It, too, is found at the end of a major advance.
Trader's perceptions of value continually fluctuate in response to rumors and unexpected news releases.
This uncertainty causes prices to move from a low to new highs.
Shortly, prices move back to new lows, only to be followed by new highs. The final push to new highs warns the trader to prepare for a strong sell-off, which will take prices to new lows and complete the megaphone top.
In the case of December wheat, the highs tended to be rather flat, but the lows were continually lower.
On the chart, I've labeled the top of the megaphone A-B, and the bottom, C-D.
Once the trader has seen the five stages take place, i.e. the swings from low to high and back again, he determines the objective of the megaphone top by measuring the distance from the highest high of the megaphone, straight down to the point at which prices break through the lower line of the megaphone. This distance is then marked downward from the point of the breakthrough. I've shown this as the Megaphone Top Objective.
Those objectives were based upon what, until that point, could be been seen on the chart. Calling those objectives was an example of trading what you see.
As you can see, prices went directly down to the objective area and then bounced.
“How Much Lower?”The downside objectives of both the head-and-shoulders top and the megaphone top, based on the methods previously described, are shown on the chart. On July 8, 1991, the December wheat contract set a low that was between the two objectives.
Free Trader's Live Chat with Joe Ross
Join our FREE Weekly Live Trader's Chat with Joe Ross on Tuesdays,
at 8 P.M., U.S. Central Time!
Visit us at http://www.tradingeducators.com/students only/chat.htm to participate in the Chat. You can also view our saved weekly Chat Logs in case you missed any Chats but want to be up-to-date.
Next Chat: Tuesday, January 9, 2007 at 8 P.M., U.S. Central Time.
NOTE: WE HAVE CHANGED OUR CHAT SOFTWARE AND PLATFORM. In order to join any of our live chats, please register with one particular username that you will use for all our chat rooms and chat sessions. Please do not register with multiple usernames or we will have to start banning those who violate the chat rules by using different identities.You need to download the instructions on how to register for free and become a chat member. Please follow this link for instructions in pdf-format and follow the steps!
Join our Trading Community Forum at Trading Educators!

© 2006 by Trading Educators, Inc
Contact
Us
1509 Jackson Drive
Cedar Park, TX 78613
Phone: 800-476-7796 or 512-249-6930
You
can e-mail us: support@spread-trading.com
Office hours are Monday - Friday 9 A.M. to 5 P.M., U.S.C.T.
Unsubscribe or change subscription
To change your subscription or to unsubscribe, scroll past the end of this
newsletter to click the "unsubsribe" link.
Disclaimer:
The Commodity Futures Trading Commission has asked us to advise you that trading spreads is complex and carries a high degree of risk. While there is opportunity for incredible wealth building, there is also the risk of losing even more than you invested. Of course, that's not unlike most other businesses. But informed traders are the best traders!